
目录
现代应用系统复杂得很,从硬件到软件,从网络到数据库,每个环节都可能出状况。建立完整的监控体系,就是要让这些潜在问题无处遁形。
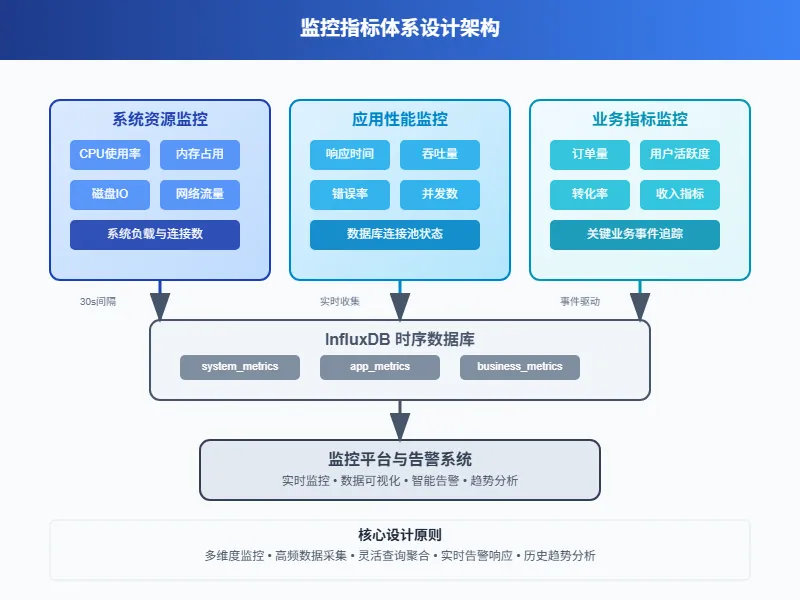
监控指标体系设计
性能监控说白了就是盯着系统的各种数据,看看哪里出问题了。就像医生给病人量体温、测血压一样,我们需要收集服务器的"生命体征"。
核心监控维度
系统资源监控
CPU使用率、内存占用、磁盘IO、网络流量这些基础指标必须要有。这就像人的基本生命体征,出问题了第一时间就能发现。
应用性能监控
响应时间、吞吐量、错误率、并发数等。这些指标直接反映用户体验,比如接口响应慢了,用户就会抱怨。
业务指标监控
订单量、用户活跃度、转化率等业务相关的数据。技术指标正常不代表业务就没问题,有时候需要从业务角度看问题。
数据模型设计
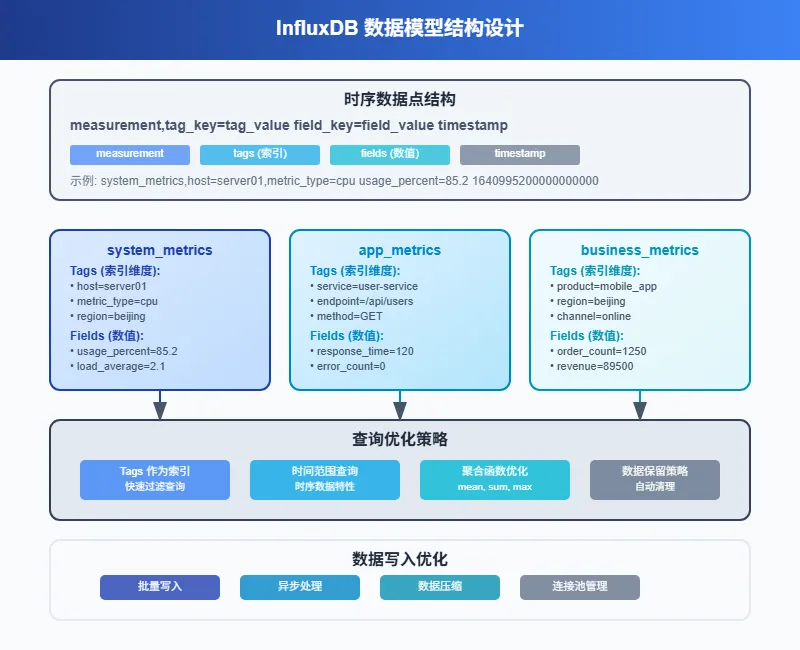
在 InfluxDB 中,我们按照不同的监控对象来设计 measurement:
text# 系统资源
system_metrics,host=server01,metric_type=cpu value=85.2 1640995200000000000
system_metrics,host=server01,metric_type=memory value=4096 1640995200000000000

# 应用性能
app_metrics,service=user-service,endpoint=/api/users response_time=120,error_count=0 1640995200000000000

# 业务指标
business_metrics,product=mobile_app,region=beijing order_count=1250,revenue=89500 1640995200000000000
系统资源监控实现
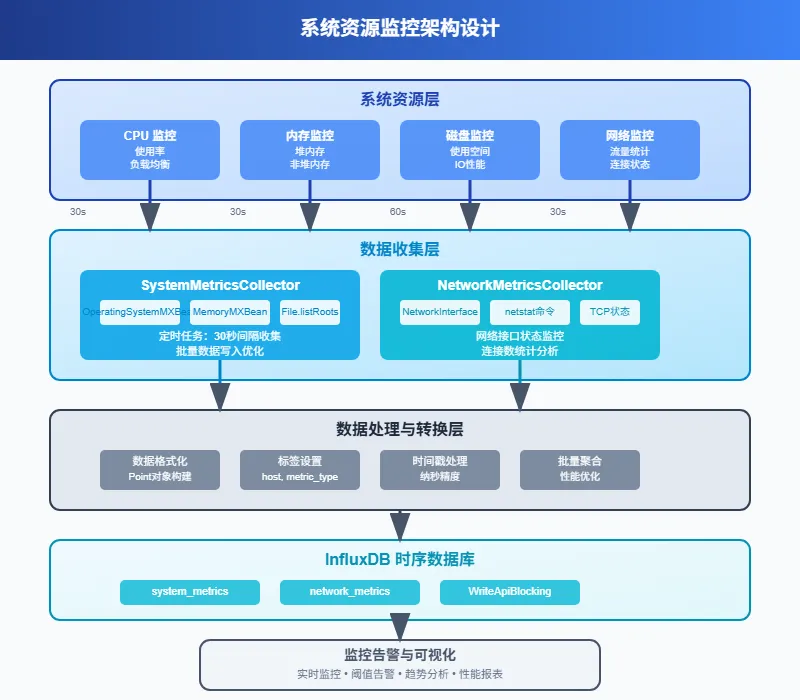
服务器基础指标收集
系统监控最基础的就是CPU、内存、磁盘、网络这四大件。我们用Java来实现一个完整的监控数据收集器。
javaimport com.influxdb.client.InfluxDBClient;
import com.influxdb.client.InfluxDBClientFactory;
import com.influxdb.client.WriteApiBlocking;
import com.influxdb.client.domain.WritePrecision;
import com.influxdb.client.write.Point;
import com.sun.management.OperatingSystemMXBean;

import java.lang.management.ManagementFactory;
import java.lang.management.MemoryMXBean;
import java.lang.management.MemoryUsage;
import java.time.Instant;
import java.util.concurrent.Executors;
import java.util.concurrent.ScheduledExecutorService;
import java.util.concurrent.TimeUnit;

@Component
public class SystemMetricsCollector {

    private final InfluxDBClient influxDBClient;
    private final WriteApiBlocking writeApi;
    private final ScheduledExecutorService scheduler;
    private final String hostname;

    public SystemMetricsCollector() {
        this.influxDBClient = InfluxDBClientFactory.create(
            "http://localhost:8086",
            "your-token".toCharArray(),
            "your-org",
            "monitoring"
        );
        this.writeApi = influxDBClient.getWriteApiBlocking();
        this.scheduler = Executors.newScheduledThreadPool(2);
        this.hostname = getHostname();
    }

    public void startCollection() {
        // 每30秒收集一次系统指标
        scheduler.scheduleAtFixedRate(this::collectSystemMetrics, 0, 30, TimeUnit.SECONDS);

        // 每60秒收集一次磁盘指标
        scheduler.scheduleAtFixedRate(this::collectDiskMetrics, 0, 60, TimeUnit.SECONDS);
    }

    private void collectSystemMetrics() {
        try {
            OperatingSystemMXBean osBean = (OperatingSystemMXBean)
                ManagementFactory.getOperatingSystemMXBean();
            MemoryMXBean memoryBean = ManagementFactory.getMemoryMXBean();

            Instant timestamp = Instant.now();

            // CPU使用率
            double cpuUsage = osBean.getProcessCpuLoad() * 100;
            Point cpuPoint = Point.measurement("system_metrics")
                .addTag("host", hostname)
                .addTag("metric_type", "cpu")
                .addField("usage_percent", cpuUsage)
                .time(timestamp, WritePrecision.NS);

            // 内存使用情况
            MemoryUsage heapMemory = memoryBean.getHeapMemoryUsage();
            long usedMemory = heapMemory.getUsed();
            long maxMemory = heapMemory.getMax();
            double memoryUsage = (double) usedMemory / maxMemory * 100;

            Point memoryPoint = Point.measurement("system_metrics")
                .addTag("host", hostname)
                .addTag("metric_type", "memory")
                .addField("used_bytes", usedMemory)
                .addField("max_bytes", maxMemory)
                .addField("usage_percent", memoryUsage)
                .time(timestamp, WritePrecision.NS);

            // 系统负载
            double systemLoad = osBean.getSystemLoadAverage();
            Point loadPoint = Point.measurement("system_metrics")
                .addTag("host", hostname)
                .addTag("metric_type", "load")
                .addField("load_average", systemLoad)
                .time(timestamp, WritePrecision.NS);

            // 批量写入
            writeApi.writePoints(Arrays.asList(cpuPoint, memoryPoint, loadPoint));

        } catch (Exception e) {
            logger.error("收集系统指标失败", e);
        }
    }

    private void collectDiskMetrics() {
        try {
            File[] roots = File.listRoots();
            Instant timestamp = Instant.now();
            List<Point> diskPoints = new ArrayList<>();

            for (File root : roots) {
                long totalSpace = root.getTotalSpace();
                long freeSpace = root.getFreeSpace();
                long usedSpace = totalSpace - freeSpace;
                double usagePercent = (double) usedSpace / totalSpace * 100;

                Point diskPoint = Point.measurement("system_metrics")
                    .addTag("host", hostname)
                    .addTag("metric_type", "disk")
                    .addTag("mount_point", root.getAbsolutePath())
                    .addField("total_bytes", totalSpace)
                    .addField("used_bytes", usedSpace)
                    .addField("free_bytes", freeSpace)
                    .addField("usage_percent", usagePercent)
                    .time(timestamp, WritePrecision.NS);

                diskPoints.add(diskPoint);
            }

            writeApi.writePoints(diskPoints);

        } catch (Exception e) {
            logger.error("收集磁盘指标失败", e);
        }
    }

    private String getHostname() {
        try {
            return InetAddress.getLocalHost().getHostName();
        } catch (Exception e) {
            return "unknown";
        }
    }
}
网络监控实现
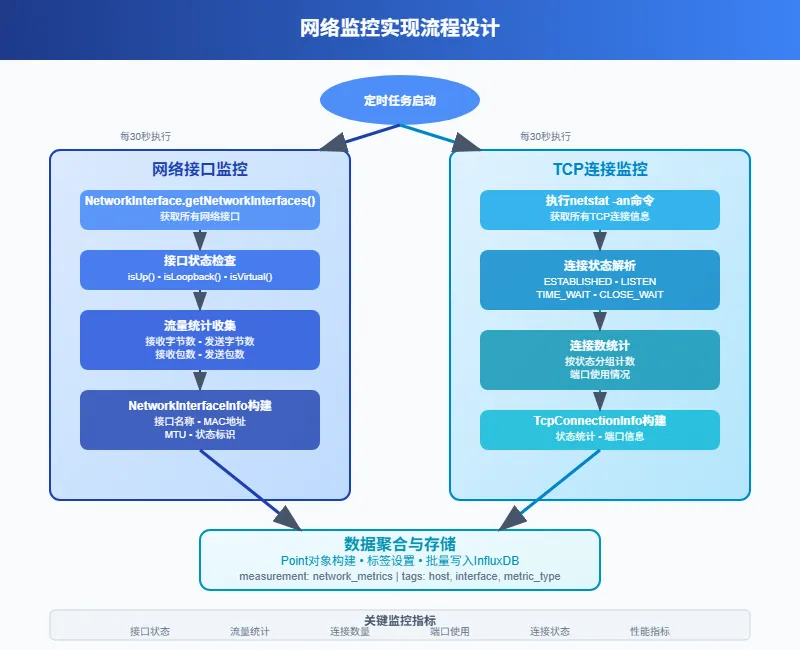
网络监控比较复杂,需要监控网络接口的流量、连接数、错误包等指标。
java@Component
public class NetworkMetricsCollector {

    private final InfluxDBClient influxDBClient;
    private final WriteApiBlocking writeApi;
    private final String hostname;

    public NetworkMetricsCollector(InfluxDBClient influxDBClient) {
        this.influxDBClient = influxDBClient;
        this.writeApi = influxDBClient.getWriteApiBlocking();
        this.hostname = getHostname();
    }

    @Scheduled(fixedRate = 30000) // 每30秒执行一次
    public void collectNetworkMetrics() {
        try {
            // 获取网络接口信息
            Enumeration<NetworkInterface> interfaces = NetworkInterface.getNetworkInterfaces();
            Instant timestamp = Instant.now();
            List<Point> networkPoints = new ArrayList<>();

            while (interfaces.hasMoreElements()) {
                NetworkInterface networkInterface = interfaces.nextElement();

                if (networkInterface.isLoopback() || !networkInterface.isUp()) {
                    continue;
                }

                String interfaceName = networkInterface.getName();

                // 这里简化处理,实际项目中可能需要读取/proc/net/dev文件
                // 或者使用SNMP等方式获取更详细的网络统计信息
                Point networkPoint = Point.measurement("network_metrics")
                    .addTag("host", hostname)
                    .addTag("interface", interfaceName)
                    .addField("status", networkInterface.isUp() ? 1 : 0)
                    .addField("mtu", networkInterface.getMTU())
                    .time(timestamp, WritePrecision.NS);

                networkPoints.add(networkPoint);
            }

            // 收集TCP连接数
            collectTcpConnections(timestamp, networkPoints);

            writeApi.writePoints(networkPoints);

        } catch (Exception e) {
            logger.error("收集网络指标失败", e);
        }
    }

    private void collectTcpConnections(Instant timestamp, List<Point> points) {
        try {
            // 在Linux系统中可以读取/proc/net/tcp文件
            // 这里提供一个简化的实现思路
            ProcessBuilder pb = new ProcessBuilder("netstat", "-an");
            Process process = pb.start();

            try (BufferedReader reader = new BufferedReader(
                    new InputStreamReader(process.getInputStream()))) {

                Map<String, Integer> connectionStates = new HashMap<>();
                String line;

                while ((line = reader.readLine()) != null) {
                    if (line.contains("tcp")) {
                        String[] parts = line.trim().split("\\s+");
                        if (parts.length >= 6) {
                            String state = parts[5];
                            connectionStates.merge(state, 1, Integer::sum);
                        }
                    }
                }

                // 写入连接状态统计
                for (Map.Entry<String, Integer> entry : connectionStates.entrySet()) {
                    Point tcpPoint = Point.measurement("network_metrics")
                        .addTag("host", hostname)
                        .addTag("metric_type", "tcp_connections")
                        .addTag("state", entry.getKey())
                        .addField("count", entry.getValue())
                        .time(timestamp, WritePrecision.NS);

                    points.add(tcpPoint);
                }
            }

        } catch (Exception e) {
            logger.warn("收集TCP连接信息失败", e);
        }
    }
}
应用性能监控
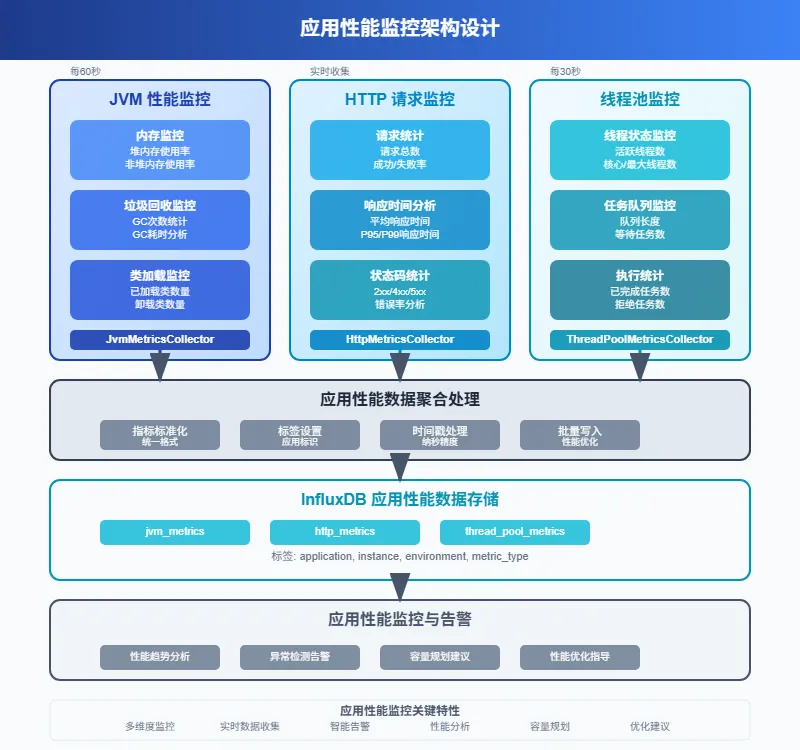
HTTP接口性能监控
java@Component
public class PerformanceInterceptor implements HandlerInterceptor {

    private final InfluxDBClient influxDBClient;
    private final WriteApiBlocking writeApi;
    private final ThreadLocal<Long> startTimeHolder = new ThreadLocal<>();

    public PerformanceInterceptor(InfluxDBClient influxDBClient) {
        this.influxDBClient = influxDBClient;
        this.writeApi = influxDBClient.getWriteApiBlocking();
    }

    @Override
    public boolean preHandle(HttpServletRequest request,
                           HttpServletResponse response,
                           Object handler) throws Exception {
        startTimeHolder.set(System.currentTimeMillis());
        return true;
    }

    @Override
    public void afterCompletion(HttpServletRequest request,
                              HttpServletResponse response,
                              Object handler,
                              Exception ex) throws Exception {
        try {
            Long startTime = startTimeHolder.get();
            if (startTime != null) {
                long responseTime = System.currentTimeMillis() - startTime;

                String method = request.getMethod();
                String uri = request.getRequestURI();
                int statusCode = response.getStatus();
                String userAgent = request.getHeader("User-Agent");
                String clientIp = getClientIp(request);

                Point performancePoint = Point.measurement("api_metrics")
                    .addTag("method", method)
                    .addTag("endpoint", uri)
                    .addTag("status_code", String.valueOf(statusCode))
                    .addTag("client_ip", clientIp)
                    .addField("response_time_ms", responseTime)
                    .addField("success", statusCode < 400 ? 1 : 0)
                    .addField("error", statusCode >= 400 ? 1 : 0)
                    .time(Instant.now(), WritePrecision.NS);

                writeApi.writePoint(performancePoint);

                // 如果响应时间超过阈值,记录慢查询
                if (responseTime > 1000) {
                    recordSlowRequest(method, uri, responseTime, statusCode);
                }
            }
        } catch (Exception e) {
            logger.error("记录性能指标失败", e);
        } finally {
            startTimeHolder.remove();
        }
    }

    private void recordSlowRequest(String method, String uri, long responseTime, int statusCode) {
        Point slowRequestPoint = Point.measurement("slow_requests")
            .addTag("method", method)
            .addTag("endpoint", uri)
            .addTag("status_code", String.valueOf(statusCode))
            .addField("response_time_ms", responseTime)
            .time(Instant.now(), WritePrecision.NS);

        writeApi.writePoint(slowRequestPoint);
    }

    private String getClientIp(HttpServletRequest request) {
        String xForwardedFor = request.getHeader("X-Forwarded-For");
        if (xForwardedFor != null && !xForwardedFor.isEmpty()) {
            return xForwardedFor.split(",")[0].trim();
        }

        String xRealIp = request.getHeader("X-Real-IP");
        if (xRealIp != null && !xRealIp.isEmpty()) {
            return xRealIp;
        }

        return request.getRemoteAddr();
    }
}
数据库性能监控
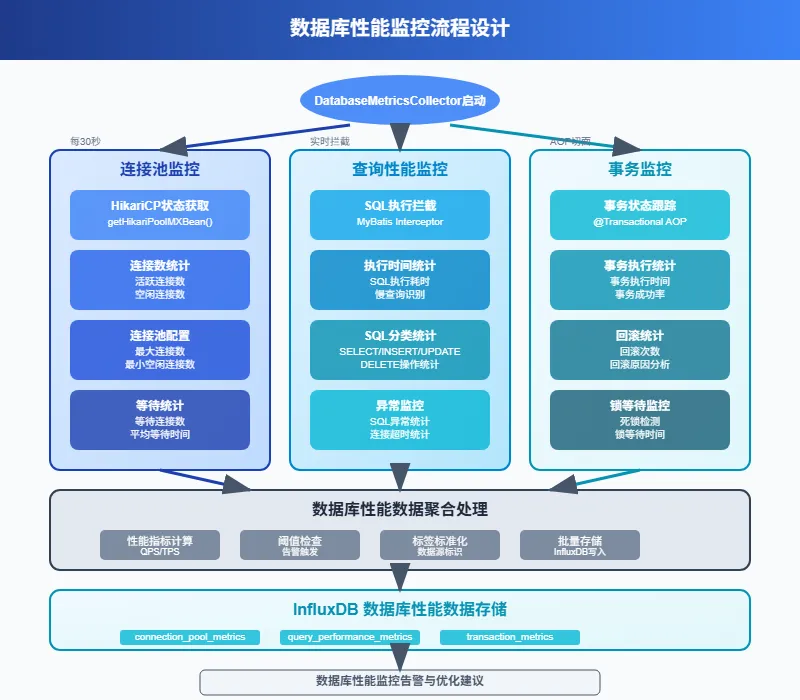
数据库是应用的核心,SQL执行时间、连接池状态、慢查询等都需要重点关注。
java@Component
public class DatabaseMetricsCollector {

    private final InfluxDBClient influxDBClient;
    private final WriteApiBlocking writeApi;
    private final DataSource dataSource;

    public DatabaseMetricsCollector(InfluxDBClient influxDBClient, DataSource dataSource) {
        this.influxDBClient = influxDBClient;
        this.writeApi = influxDBClient.getWriteApiBlocking();
        this.dataSource = dataSource;
    }

    @Scheduled(fixedRate = 60000) // 每分钟收集一次
    public void collectDatabaseMetrics() {
        try {
            Instant timestamp = Instant.now();
            List<Point> dbPoints = new ArrayList<>();

            // 收集连接池信息
            if (dataSource instanceof HikariDataSource) {
                HikariDataSource hikariDS = (HikariDataSource) dataSource;
                HikariPoolMXBean poolBean = hikariDS.getHikariPoolMXBean();

                Point poolPoint = Point.measurement("database_metrics")
                    .addTag("metric_type", "connection_pool")
                    .addTag("pool_name", hikariDS.getPoolName())
                    .addField("active_connections", poolBean.getActiveConnections())
                    .addField("idle_connections", poolBean.getIdleConnections())
                    .addField("total_connections", poolBean.getTotalConnections())
                    .addField("threads_awaiting_connection", poolBean.getThreadsAwaitingConnection())
                    .time(timestamp, WritePrecision.NS);

                dbPoints.add(poolPoint);
            }

            // 收集数据库状态信息
            collectDatabaseStatus(timestamp, dbPoints);

            writeApi.writePoints(dbPoints);

        } catch (Exception e) {
            logger.error("收集数据库指标失败", e);
        }
    }

    private void collectDatabaseStatus(Instant timestamp, List<Point> points) {
        try (Connection connection = dataSource.getConnection()) {

            // 查询数据库连接数
            String connectionCountSql = "SHOW STATUS LIKE 'Threads_connected'";
            try (PreparedStatement stmt = connection.prepareStatement(connectionCountSql);
                 ResultSet rs = stmt.executeQuery()) {

                if (rs.next()) {
                    int connectionCount = rs.getInt("Value");
                    Point connectionPoint = Point.measurement("database_metrics")
                        .addTag("metric_type", "connections")
                        .addField("current_connections", connectionCount)
                        .time(timestamp, WritePrecision.NS);

                    points.add(connectionPoint);
                }
            }

            // 查询慢查询数量
            String slowQuerySql = "SHOW STATUS LIKE 'Slow_queries'";
            try (PreparedStatement stmt = connection.prepareStatement(slowQuerySql);
                 ResultSet rs = stmt.executeQuery()) {

                if (rs.next()) {
                    int slowQueries = rs.getInt("Value");
                    Point slowQueryPoint = Point.measurement("database_metrics")
                        .addTag("metric_type", "slow_queries")
                        .addField("slow_query_count", slowQueries)
                        .time(timestamp, WritePrecision.NS);

                    points.add(slowQueryPoint);
                }
            }

            // 查询查询缓存命中率
            collectQueryCacheMetrics(connection, timestamp, points);

        } catch (Exception e) {
            logger.error("收集数据库状态失败", e);
        }
    }

    private void collectQueryCacheMetrics(Connection connection, Instant timestamp, List<Point> points) {
        try {
            String cacheSql = "SHOW STATUS WHERE Variable_name IN ('Qcache_hits', 'Qcache_inserts', 'Qcache_not_cached')";
            try (PreparedStatement stmt = connection.prepareStatement(cacheSql);
                 ResultSet rs = stmt.executeQuery()) {

                Map<String, Long> cacheStats = new HashMap<>();
                while (rs.next()) {
                    cacheStats.put(rs.getString("Variable_name"), rs.getLong("Value"));
                }

                long hits = cacheStats.getOrDefault("Qcache_hits", 0L);
                long inserts = cacheStats.getOrDefault("Qcache_inserts", 0L);
                long notCached = cacheStats.getOrDefault("Qcache_not_cached", 0L);

                long totalQueries = hits + inserts + notCached;
                double hitRate = totalQueries > 0 ? (double) hits / totalQueries * 100 : 0;

                Point cachePoint = Point.measurement("database_metrics")
                    .addTag("metric_type", "query_cache")
                    .addField("cache_hits", hits)
                    .addField("cache_inserts", inserts)
                    .addField("cache_not_cached", notCached)
                    .addField("hit_rate_percent", hitRate)
                    .time(timestamp, WritePrecision.NS);

                points.add(cachePoint);
            }
        } catch (Exception e) {
            logger.warn("收集查询缓存指标失败", e);
        }
    }
}
业务指标监控
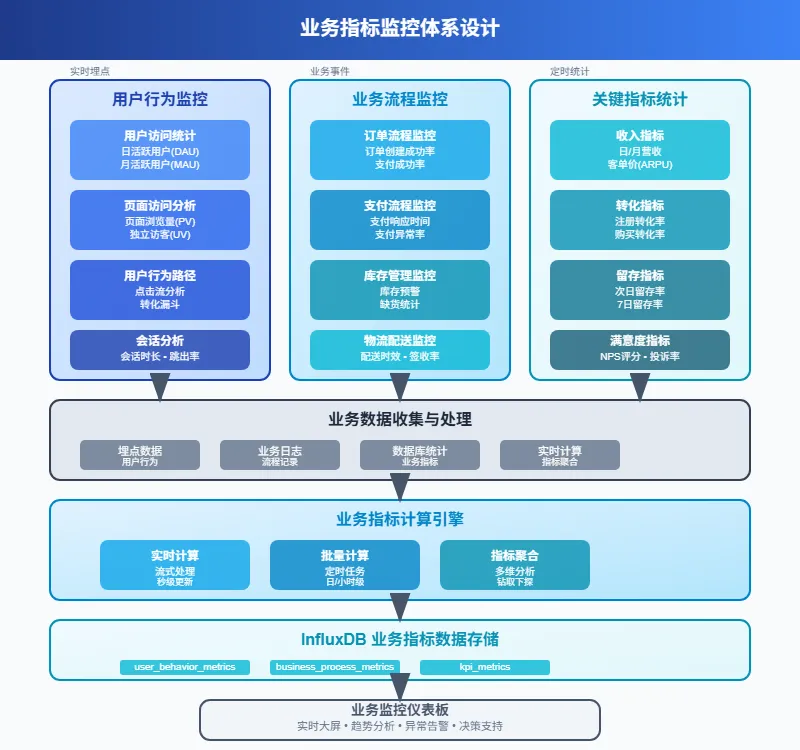
业务事件追踪
除了技术指标,业务指标同样重要。用户注册、订单创建、支付成功等关键业务事件都需要监控。
java@Service
public class BusinessMetricsService {

    private final InfluxDBClient influxDBClient;
    private final WriteApiBlocking writeApi;

    public BusinessMetricsService(InfluxDBClient influxDBClient) {
        this.influxDBClient = influxDBClient;
        this.writeApi = influxDBClient.getWriteApiBlocking();
    }

    public void recordUserRegistration(String userId, String source, String region) {
        Point registrationPoint = Point.measurement("business_events")
            .addTag("event_type", "user_registration")
            .addTag("source", source)
            .addTag("region", region)
            .addField("user_id", userId)
            .addField("count", 1)
            .time(Instant.now(), WritePrecision.NS);

        writeApi.writePoint(registrationPoint);
    }

    public void recordOrderCreated(String orderId, String userId, double amount, String productCategory) {
        Point orderPoint = Point.measurement("business_events")
            .addTag("event_type", "order_created")
            .addTag("product_category", productCategory)
            .addField("order_id", orderId)
            .addField("user_id", userId)
            .addField("amount", amount)
            .addField("count", 1)
            .time(Instant.now(), WritePrecision.NS);

        writeApi.writePoint(orderPoint);
    }

    public void recordPaymentResult(String orderId, String paymentMethod, boolean success, double amount) {
        Point paymentPoint = Point.measurement("business_events")
            .addTag("event_type", "payment")
            .addTag("payment_method", paymentMethod)
            .addTag("status", success ? "success" : "failed")
            .addField("order_id", orderId)
            .addField("amount", amount)
            .addField("success", success ? 1 : 0)
            .addField("count", 1)
            .time(Instant.now(), WritePrecision.NS);

        writeApi.writePoint(paymentPoint);
    }

    @Scheduled(fixedRate = 300000) // 每5分钟统计一次
    public void calculateBusinessMetrics() {
        try {
            Instant now = Instant.now();
            Instant fiveMinutesAgo = now.minus(5, ChronoUnit.MINUTES);

            // 计算最近5分钟的业务指标
            calculateRecentMetrics(fiveMinutesAgo, now);

        } catch (Exception e) {
            logger.error("计算业务指标失败", e);
        }
    }

    private void calculateRecentMetrics(Instant start, Instant end) {
        try {
            QueryApi queryApi = influxDBClient.getQueryApi();

            // 查询最近5分钟的注册数
            String registrationQuery = String.format(
                "from(bucket: \"monitoring\") " +
                "|> range(start: %s, stop: %s) " +
                "|> filter(fn: (r) => r._measurement == \"business_events\" and r.event_type == \"user_registration\") " +
                "|> count()",
                start.toString(), end.toString()
            );

            List<FluxTable> registrationTables = queryApi.query(registrationQuery);
            int registrationCount = extractCountFromQuery(registrationTables);

            // 查询最近5分钟的订单金额
            String orderAmountQuery = String.format(
                "from(bucket: \"monitoring\") " +
                "|> range(start: %s, stop: %s) " +
                "|> filter(fn: (r) => r._measurement == \"business_events\" and r.event_type == \"order_created\") " +
                "|> sum(column: \"amount\")",
                start.toString(), end.toString()
            );

            List<FluxTable> orderTables = queryApi.query(orderAmountQuery);
            double totalOrderAmount = extractSumFromQuery(orderTables);

            // 记录汇总指标
            Point summaryPoint = Point.measurement("business_summary")
                .addTag("time_window", "5min")
                .addField("registration_count", registrationCount)
                .addField("total_order_amount", totalOrderAmount)
                .time(end, WritePrecision.NS);

            writeApi.writePoint(summaryPoint);

        } catch (Exception e) {
            logger.error("计算业务汇总指标失败", e);
        }
    }

    private int extractCountFromQuery(List<FluxTable> tables) {
        return tables.stream()
            .flatMap(table -> table.getRecords().stream())
            .mapToInt(record -> ((Number) record.getValue()).intValue())
            .sum();
    }

    private double extractSumFromQuery(List<FluxTable> tables) {
        return tables.stream()
            .flatMap(table -> table.getRecords().stream())
            .mapToDouble(record -> ((Number) record.getValue()).doubleValue())
            .sum();
    }
}
实时告警机制
监控数据收集了,还需要及时发现异常。我们可以实现一个简单的告警系统。
java@Service
public class AlertService {

    private final InfluxDBClient influxDBClient;
    private final NotificationService notificationService;

    public AlertService(InfluxDBClient influxDBClient, NotificationService notificationService) {
        this.influxDBClient = influxDBClient;
        this.notificationService = notificationService;
    }

    @Scheduled(fixedRate = 60000) // 每分钟检查一次
    public void checkAlerts() {
        try {
            checkCpuUsage();
            checkMemoryUsage();
            checkResponseTime();
            checkErrorRate();

        } catch (Exception e) {
            logger.error("检查告警失败", e);
        }
    }

    private void checkCpuUsage() {
        try {
            QueryApi queryApi = influxDBClient.getQueryApi();

            String query = "from(bucket: \"monitoring\") " +
                "|> range(start: -5m) " +
                "|> filter(fn: (r) => r._measurement == \"system_metrics\" and r.metric_type == \"cpu\") " +
                "|> mean()";

            List<FluxTable> tables = queryApi.query(query);

            for (FluxTable table : tables) {
                for (FluxRecord record : table.getRecords()) {
                    double cpuUsage = ((Number) record.getValue()).doubleValue();
                    String host = (String) record.getValueByKey("host");

                    if (cpuUsage > 80) {
                        String message = String.format("服务器 %s CPU使用率过高: %.2f%%", host, cpuUsage);
                        notificationService.sendAlert("CPU_HIGH", message, AlertLevel.WARNING);
                    }

                    if (cpuUsage > 95) {
                        String message = String.format("服务器 %s CPU使用率严重过高: %.2f%%", host, cpuUsage);
                        notificationService.sendAlert("CPU_CRITICAL", message, AlertLevel.CRITICAL);
                    }
                }
            }

        } catch (Exception e) {
            logger.error("检查CPU使用率告警失败", e);
        }
    }

    private void checkResponseTime() {
        try {
            QueryApi queryApi = influxDBClient.getQueryApi();

            String query = "from(bucket: \"monitoring\") " +
                "|> range(start: -10m) " +
                "|> filter(fn: (r) => r._measurement == \"api_metrics\") " +
                "|> group(columns: [\"endpoint\"]) " +
                "|> mean(column: \"response_time_ms\")";

            List<FluxTable> tables = queryApi.query(query);

            for (FluxTable table : tables) {
                for (FluxRecord record : table.getRecords()) {
                    double avgResponseTime = ((Number) record.getValue()).doubleValue();
                    String endpoint = (String) record.getValueByKey("endpoint");

                    if (avgResponseTime > 2000) {
                        String message = String.format("接口 %s 平均响应时间过长: %.0fms", endpoint, avgResponseTime);
                        notificationService.sendAlert("RESPONSE_TIME_HIGH", message, AlertLevel.WARNING);
                    }
                }
            }

        } catch (Exception e) {
            logger.error("检查响应时间告警失败", e);
        }
    }

    private void checkErrorRate() {
        try {
            QueryApi queryApi = influxDBClient.getQueryApi();

            String query = "from(bucket: \"monitoring\") " +
                "|> range(start: -10m) " +
                "|> filter(fn: (r) => r._measurement == \"api_metrics\") " +
                "|> group(columns: [\"endpoint\"]) " +
                "|> aggregateWindow(every: 10m, fn: sum) " +
                "|> pivot(rowKey:[\"_time\"], columnKey: [\"_field\"], valueColumn: \"_value\") " +
                "|> map(fn: (r) => ({ r with error_rate: float(v: r.error) / float(v: r.success + r.error) * 100.0 }))";

            List<FluxTable> tables = queryApi.query(query);

            for (FluxTable table : tables) {
                for (FluxRecord record : table.getRecords()) {
                    Object errorRateObj = record.getValueByKey("error_rate");
                    if (errorRateObj != null) {
                        double errorRate = ((Number) errorRateObj).doubleValue();
                        String endpoint = (String) record.getValueByKey("endpoint");

                        if (errorRate > 5) {
                            String message = String.format("接口 %s 错误率过高: %.2f%%", endpoint, errorRate);
                            notificationService.sendAlert("ERROR_RATE_HIGH", message, AlertLevel.WARNING);
                        }
                    }
                }
            }

        } catch (Exception e) {
            logger.error("检查错误率告警失败", e);
        }
    }
}

enum AlertLevel {
    INFO, WARNING, CRITICAL
}

@Service
public class NotificationService {

    public void sendAlert(String alertType, String message, AlertLevel level) {
        // 这里可以集成邮件、短信、钉钉、企业微信等通知方式
        logger.warn("告警通知 [{}] {}: {}", level, alertType, message);

        // 发送邮件通知
        sendEmailAlert(alertType, message, level);

        // 发送钉钉通知
        sendDingTalkAlert(alertType, message, level);
    }

    private void sendEmailAlert(String alertType, String message, AlertLevel level) {
        // 邮件发送逻辑
    }

    private void sendDingTalkAlert(String alertType, String message, AlertLevel level) {
        // 钉钉机器人通知逻辑
    }
}
性能优化与最佳实践
数据写入优化
监控数据量通常很大,写入性能很关键。批量写入、异步处理、数据压缩都是常用的优化手段。
java@Configuration
public class InfluxDBOptimizedConfig {

    @Bean
    public InfluxDBClient influxDBClient() {
        return InfluxDBClientFactory.create(
            "http://localhost:8086",
            "your-token".toCharArray(),
            "your-org",
            "monitoring"
        );
    }

    @Bean
    public WriteApi writeApi(InfluxDBClient client) {
        WriteOptions options = WriteOptions.builder()
            .batchSize(1000)  // 批量大小
            .flushInterval(5000)  // 刷新间隔5秒
            .bufferLimit(10000)  // 缓冲区大小
            .retryInterval(1000)  // 重试间隔
            .maxRetries(3)  // 最大重试次数
            .build();

        return client.makeWriteApi(options);
    }
}

@Service
public class OptimizedMetricsCollector {

    private final WriteApi writeApi;
    private final BlockingQueue<Point> metricsQueue;
    private final ScheduledExecutorService scheduler;

    public OptimizedMetricsCollector(WriteApi writeApi) {
        this.writeApi = writeApi;
        this.metricsQueue = new LinkedBlockingQueue<>(50000);
        this.scheduler = Executors.newScheduledThreadPool(2);

        // 启动批量写入任务
        startBatchWriter();
    }

    public void recordMetric(Point point) {
        try {
            if (!metricsQueue.offer(point)) {
                logger.warn("指标队列已满,丢弃数据点");
            }
        } catch (Exception e) {
            logger.error("记录指标失败", e);
        }
    }

    private void startBatchWriter() {
        scheduler.scheduleAtFixedRate(() -> {
            try {
                List<Point> batch = new ArrayList<>();
                metricsQueue.drainTo(batch, 1000);

                if (!batch.isEmpty()) {
                    writeApi.writePoints(batch);
                    logger.debug("批量写入 {} 个数据点", batch.size());
                }

            } catch (Exception e) {
                logger.error("批量写入失败", e);
            }
        }, 0, 5, TimeUnit.SECONDS);
    }

    @PreDestroy
    public void shutdown() {
        try {
            scheduler.shutdown();
            if (!scheduler.awaitTermination(10, TimeUnit.SECONDS)) {
                scheduler.shutdownNow();
            }

            // 写入剩余数据
            List<Point> remaining = new ArrayList<>();
            metricsQueue.drainTo(remaining);
            if (!remaining.isEmpty()) {
                writeApi.writePoints(remaining);
            }

        } catch (Exception e) {
            logger.error("关闭指标收集器失败", e);
        }
    }
}
查询性能优化
监控查询通常涉及大量数据,合理的索引设计和查询优化很重要。
java@Service
public class OptimizedQueryService {

    private final InfluxDBClient influxDBClient;
    private final QueryApi queryApi;

    public OptimizedQueryService(InfluxDBClient influxDBClient) {
        this.influxDBClient = influxDBClient;
        this.queryApi = influxDBClient.getQueryApi();
    }

    // 优化的时间范围查询
    public List<MetricData> getMetricsInTimeRange(String measurement,
                                                  String host,
                                                  Instant start,
                                                  Instant end) {
        // 使用参数化查询,避免字符串拼接
        String query = "from(bucket: \"monitoring\") " +
            "|> range(start: " + start + ", stop: " + end + ") " +
            "|> filter(fn: (r) => r._measurement == \"" + measurement + "\") " +
            "|> filter(fn: (r) => r.host == \"" + host + "\") " +
            "|> aggregateWindow(every: 1m, fn: mean, createEmpty: false)";

        List<FluxTable> tables = queryApi.query(query);
        return convertToMetricData(tables);
    }

    // 聚合查询优化
    public Map<String, Double> getAggregatedMetrics(String measurement,
                                                   Duration timeWindow) {
        Instant end = Instant.now();
        Instant start = end.minus(timeWindow);

        String query = "from(bucket: \"monitoring\") " +
            "|> range(start: " + start + ", stop: " + end + ") " +
            "|> filter(fn: (r) => r._measurement == \"" + measurement + "\") " +
            "|> group(columns: [\"host\"]) " +
            "|> mean()";

        List<FluxTable> tables = queryApi.query(query);
        Map<String, Double> result = new HashMap<>();

        for (FluxTable table : tables) {
            for (FluxRecord record : table.getRecords()) {
                String host = (String) record.getValueByKey("host");
                Double value = ((Number) record.getValue()).doubleValue();
                result.put(host, value);
            }
        }

        return result;
    }

    // 分页查询大量数据
    public PagedResult<MetricData> getMetricsPaged(String measurement,
                                                  int page,
                                                  int size,
                                                  Instant start,
                                                  Instant end) {
        int offset = page * size;

        String query = "from(bucket: \"monitoring\") " +
            "|> range(start: " + start + ", stop: " + end + ") " +
            "|> filter(fn: (r) => r._measurement == \"" + measurement + "\") " +
            "|> sort(columns: [\"_time\"], desc: true) " +
            "|> limit(n: " + size + ", offset: " + offset + ")";

        List<FluxTable> tables = queryApi.query(query);
        List<MetricData> data = convertToMetricData(tables);

        // 获取总数(简化实现)
        long total = getTotalCount(measurement, start, end);

        return new PagedResult<>(data, page, size, total);
    }

    private List<MetricData> convertToMetricData(List<FluxTable> tables) {
        List<MetricData> result = new ArrayList<>();

        for (FluxTable table : tables) {
            for (FluxRecord record : table.getRecords()) {
                MetricData data = new MetricData();
                data.setTime(record.getTime());
                data.setMeasurement(record.getMeasurement());
                data.setValue(((Number) record.getValue()).doubleValue());
                data.setHost((String) record.getValueByKey("host"));
                result.add(data);
            }
        }

        return result;
    }

    private long getTotalCount(String measurement, Instant start, Instant end) {
        String countQuery = "from(bucket: \"monitoring\") " +
            "|> range(start: " + start + ", stop: " + end + ") " +
            "|> filter(fn: (r) => r._measurement == \"" + measurement + "\") " +
            "|> count()";

        List<FluxTable> tables = queryApi.query(countQuery);
        return tables.stream()
            .flatMap(table -> table.getRecords().stream())
            .mapToLong(record -> ((Number) record.getValue()).longValue())
            .sum();
    }
}

class MetricData {
    private Instant time;
    private String measurement;
    private Double value;
    private String host;

    // getters and setters
}

class PagedResult<T> {
    private List<T> data;
    private int page;
    private int size;
    private long total;
    private int totalPages;

    public PagedResult(List<T> data, int page, int size, long total) {
        this.data = data;
        this.page = page;
        this.size = size;
        this.total = total;
        this.totalPages = (int) Math.ceil((double) total / size);
    }

    // getters and setters
}
这套监控系统涵盖了从系统资源到业务指标的全方位监控,通过Java代码实现了自动化的数据收集、存储和告警。关键是要根据实际业务需求调整监控指标和告警阈值,确保监控系统既能及时发现问题,又不会产生太多噪音。
记住,监控不是目的,快速发现和解决问题才是。好的监控系统应该让你在问题影响用户之前就能发现并处理。


本文作者:柳始恭
本文链接:
版权声明:本博客所有文章除特别声明外,均采用 BY-NC-SA 许可协议。转载请注明出处!