
目录
在海量数据中,InfluxDB 是如何快速提取有用信息的呢?接下来我们来学习一下聚合函数与数据分析
聚合函数基础
InfluxDB 的聚合函数就像是数据的"计算器",帮你从海量时序数据中提取有用信息。想象一下,你有一个月的服务器CPU使用率数据,每秒一个点,总共260万个数据点。直接看这些原始数据根本没法分析,但用聚合函数就能快速算出平均值、最大值、趋势等关键指标。
聚合函数的核心作用是把大量数据"压缩"成少量有意义的统计值。比如把一天24小时的温度数据压缩成每小时的平均温度,这样既保留了数据的规律性,又大大减少了数据量。
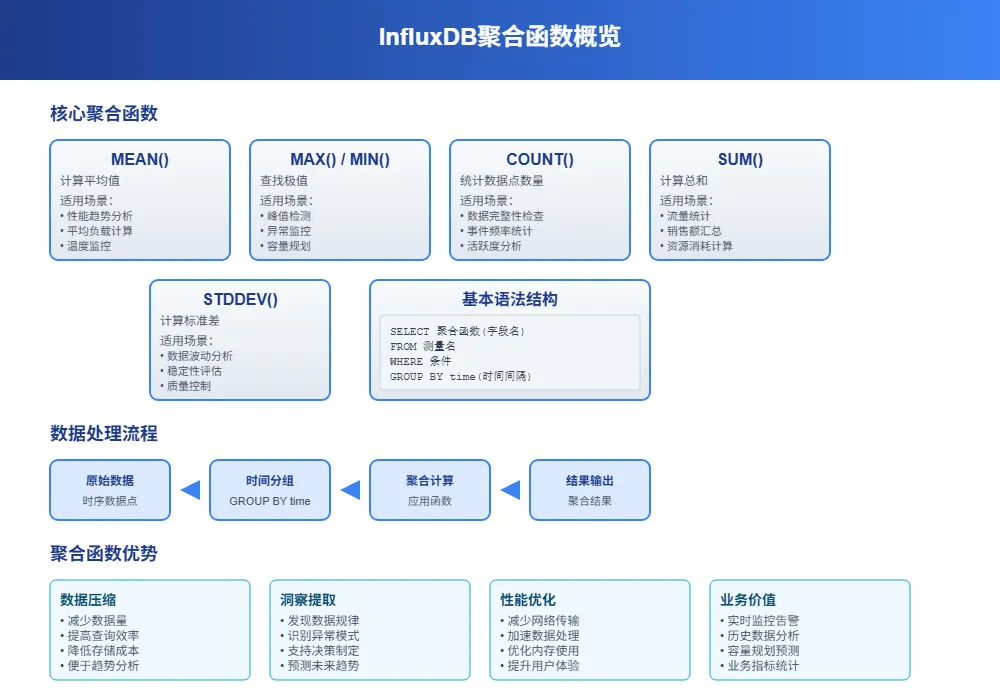
常用聚合函数概览
MEAN() - 计算平均值
最常用的函数,适合分析趋势。比如计算服务器一天的平均CPU使用率。
MAX()和MIN() - 找最大值和最小值
用来发现异常峰值或最低点。比如找出一周内服务器的最高负载时刻。
COUNT() - 统计数据点数量
检查数据完整性的好工具。比如看看传感器是否按预期频率上报数据。
SUM() - 求和
适合累积类数据。比如统计一天的总流量、总销售额等。
STDDEV() - 标准差
衡量数据波动程度。数值越大说明数据越不稳定。
基本语法结构
InfluxDB 聚合函数的基本语法很直观:
sqlSELECT <聚合函数>(字段名) FROM 测量名 WHERE 条件 GROUP BY time(时间间隔)
举个实际例子:
sqlSELECT MEAN(cpu_usage) FROM system_metrics
WHERE time >= now() - 1h
GROUP BY time(5m)
这条查询的意思是:从系统指标表中查询最近1小时的数据,按5分钟为间隔计算CPU使用率的平均值。
时间窗口聚合
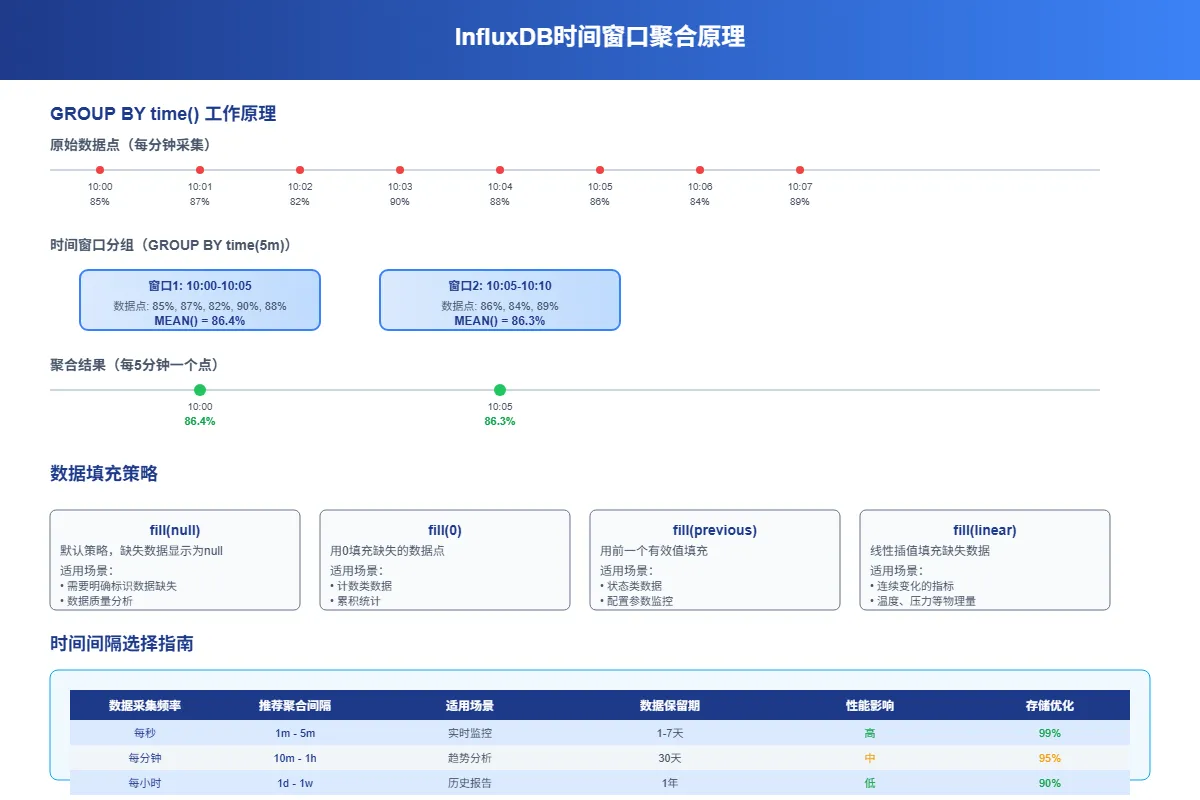
GROUP BY time 详解
时间窗口聚合是InfluxDB最强大的功能之一。它能把连续的时间数据按指定间隔分组,然后对每组数据进行聚合计算。
时间间隔语法
- 5m = 5分钟
- 1h = 1小时
- 1d = 1天
- 1w = 1周
sql-- 按小时计算平均温度
SELECT MEAN(temperature) FROM sensors
WHERE time >= now() - 24h
GROUP BY time(1h)

-- 按天计算最大网络流量
SELECT MAX(network_bytes) FROM network_stats
WHERE time >= now() - 30d
GROUP BY time(1d)
填充缺失数据
实际环境中,数据经常会有缺失。InfluxDB 提供了几种填充策略:
fill(null) - 用null填充(默认)
sqlSELECT MEAN(cpu_usage) FROM system_metrics
WHERE time >= now() - 2h
GROUP BY time(10m) fill(null)
fill(0) - 用0填充
sqlSELECT SUM(request_count) FROM web_logs
WHERE time >= now() - 1d
GROUP BY time(1h) fill(0)
fill(previous) - 用前一个值填充
sqlSELECT LAST(temperature) FROM sensors
WHERE time >= now() - 6h
GROUP BY time(30m) fill(previous)
fill(linear) - 线性插值填充
sqlSELECT MEAN(pressure) FROM weather_data
WHERE time >= now() - 12h
GROUP BY time(1h) fill(linear)
高级聚合分析
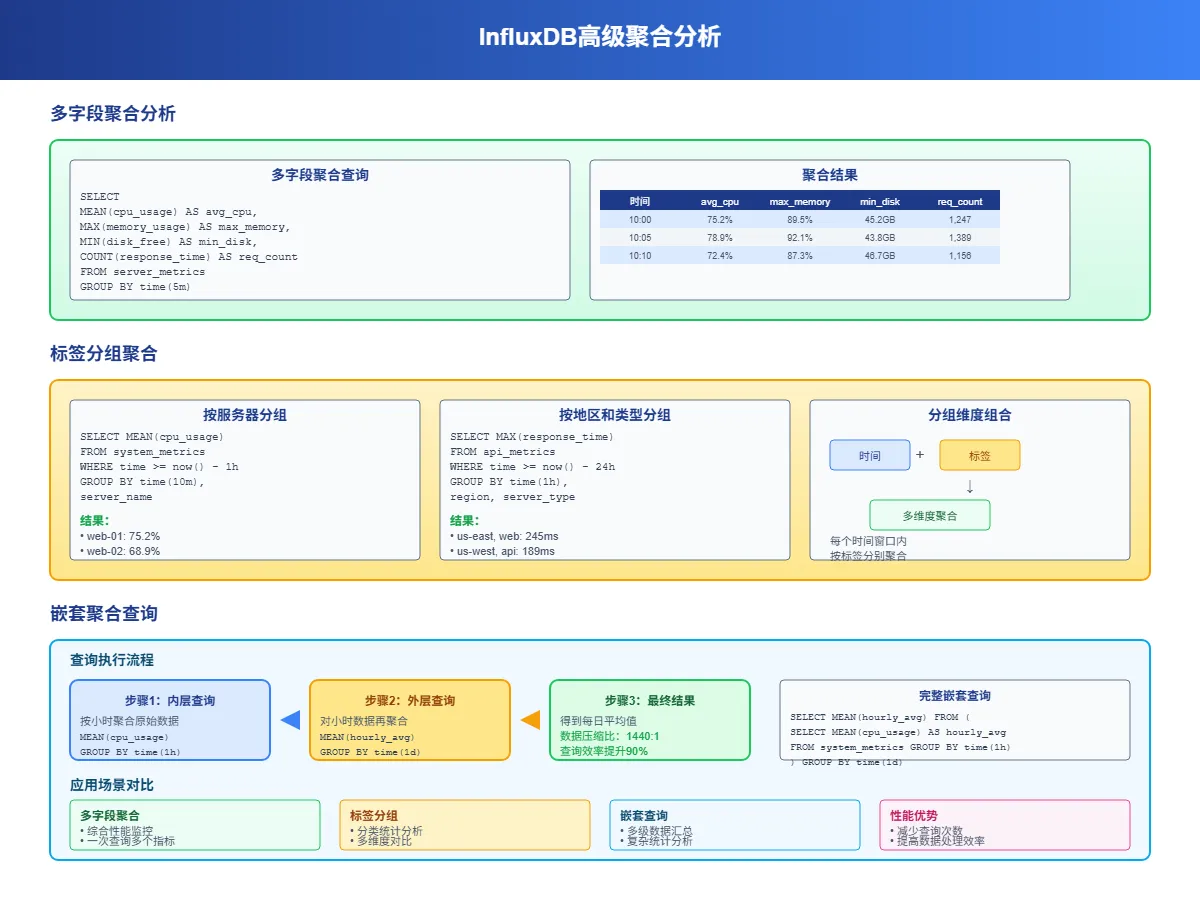
多字段聚合
一次查询可以对多个字段进行不同的聚合操作:
sqlSELECT
    MEAN(cpu_usage) AS avg_cpu,
    MAX(memory_usage) AS max_memory,
    MIN(disk_free) AS min_disk,
    COUNT(response_time) AS request_count
FROM server_metrics
WHERE time >= now() - 1h
GROUP BY time(5m)
这样一条查询就能得到服务器的综合性能指标,比分别查询效率高很多。
标签分组聚合
除了按时间分组,还可以按标签分组,实现更细粒度的分析:
sql-- 按服务器分组统计
SELECT MEAN(cpu_usage) FROM system_metrics
WHERE time >= now() - 1h
GROUP BY time(10m), server_name

-- 按地区和服务器类型分组
SELECT MAX(response_time) FROM api_metrics
WHERE time >= now() - 24h
GROUP BY time(1h), region, server_type
嵌套聚合查询
InfluxDB 支持子查询,可以对聚合结果再次聚合:
sql-- 先按小时聚合,再计算日平均
SELECT MEAN(hourly_avg) FROM (
    SELECT MEAN(cpu_usage) AS hourly_avg
    FROM system_metrics
    WHERE time >= now() - 7d
    GROUP BY time(1h)
) GROUP BY time(1d)
实用聚合场景
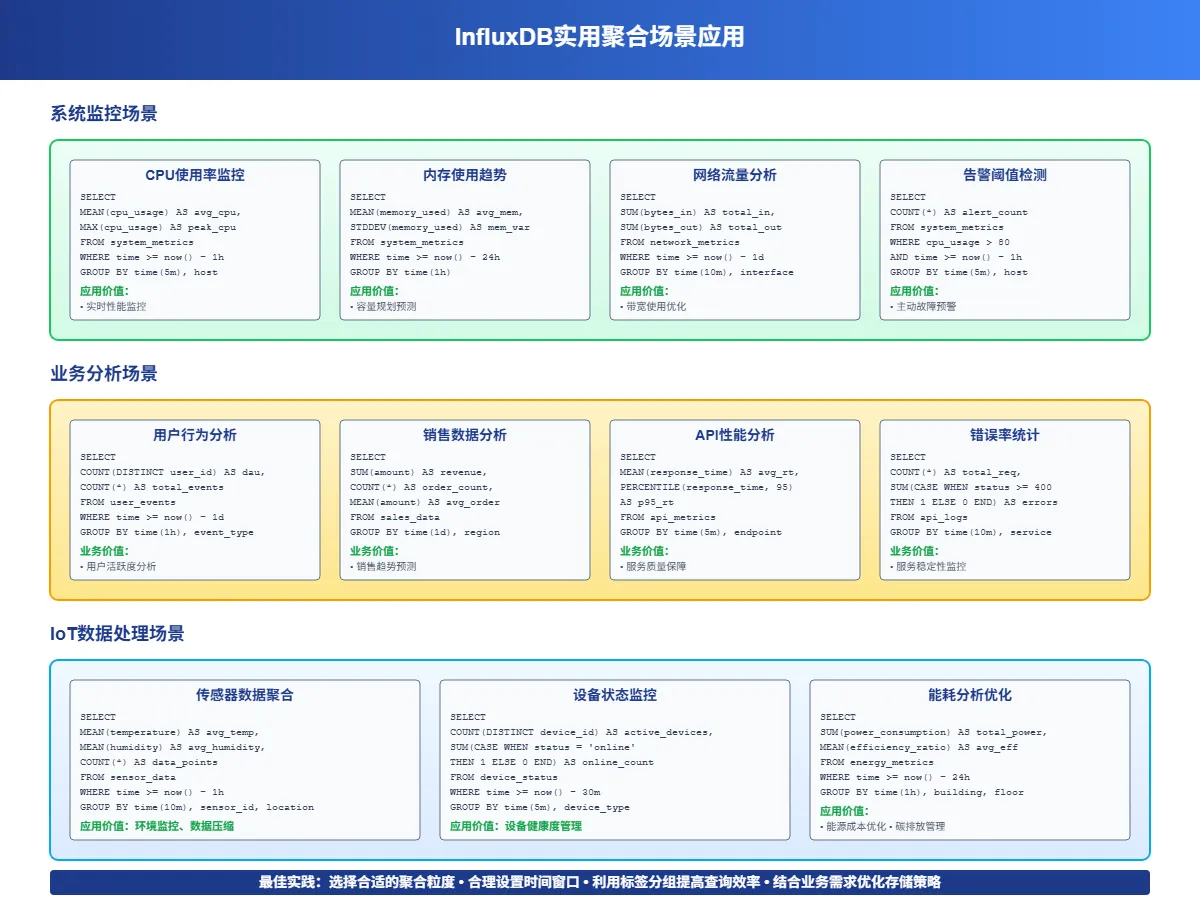
性能监控分析
服务器负载趋势分析
sql-- 计算每小时的平均负载和峰值负载
SELECT
    MEAN(cpu_usage) AS avg_load,
    MAX(cpu_usage) AS peak_load,
    STDDEV(cpu_usage) AS load_variance
FROM server_metrics
WHERE time >= now() - 7d
GROUP BY time(1h), server_id
网络流量统计
sql-- 统计每天的总流量和峰值流量
SELECT
    SUM(bytes_in + bytes_out) AS total_traffic,
    MAX(bytes_in + bytes_out) AS peak_traffic
FROM network_stats
WHERE time >= now() - 30d
GROUP BY time(1d)
业务指标分析
用户活跃度统计
sql-- 计算每小时活跃用户数和平均会话时长
SELECT
    COUNT(DISTINCT user_id) AS active_users,
    MEAN(session_duration) AS avg_session_time
FROM user_activity
WHERE time >= now() - 24h
GROUP BY time(1h)
销售数据分析
sql-- 按产品类别统计每日销售额
SELECT
    SUM(amount) AS daily_sales,
    COUNT(*) AS order_count,
    MEAN(amount) AS avg_order_value
FROM sales_data
WHERE time >= now() - 30d
GROUP BY time(1d), product_category
Java客户端聚合查询
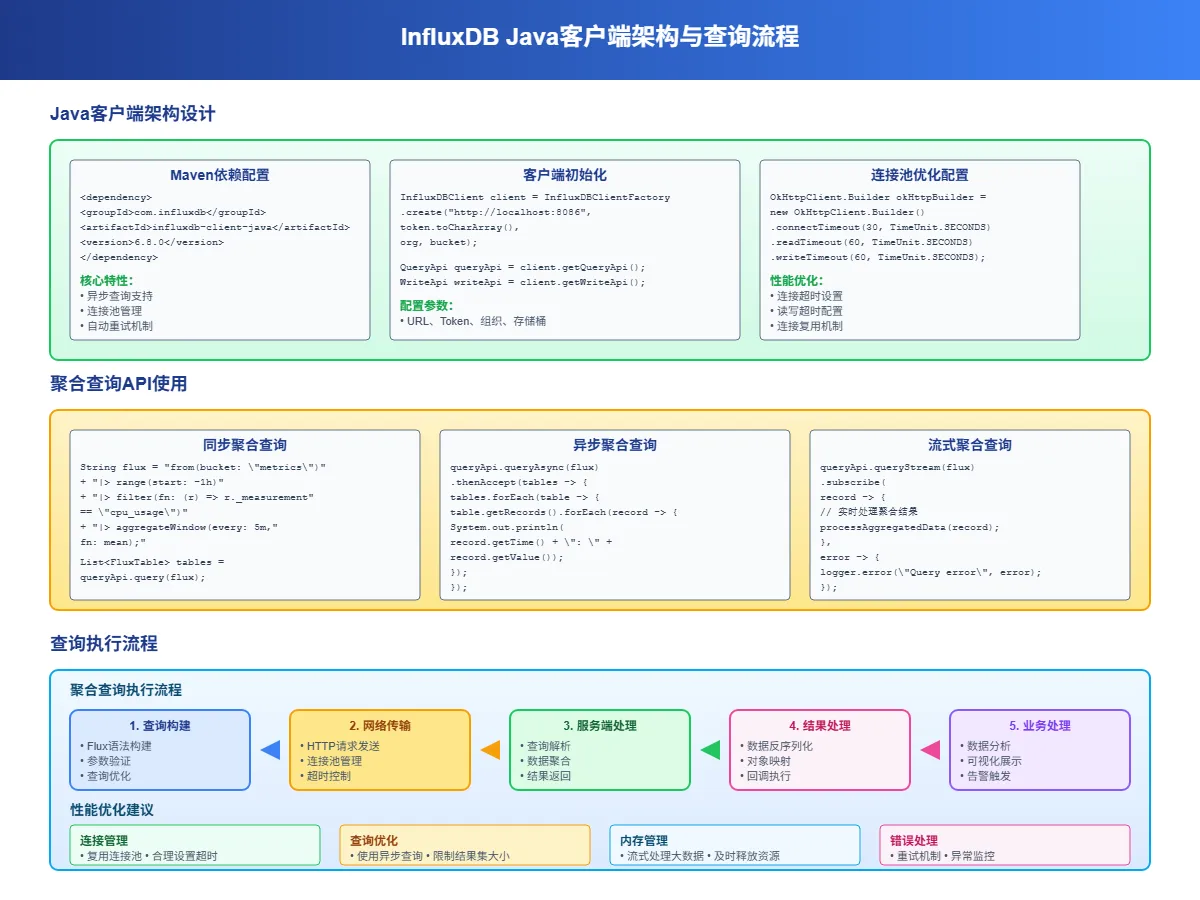
Maven依赖配置
xml<dependency>
    <groupId>com.influxdb</groupId>
    <artifactId>influxdb-client-java</artifactId>
    <version>6.7.0</version>
</dependency>
基础聚合查询
javaimport com.influxdb.client.InfluxDBClient;
import com.influxdb.client.InfluxDBClientFactory;
import com.influxdb.client.QueryApi;
import com.influxdb.query.FluxTable;
import com.influxdb.query.FluxRecord;

public class InfluxAggregationExample {

    private static final String TOKEN = "your-token";
    private static final String ORG = "your-org";
    private static final String BUCKET = "your-bucket";

    public void performBasicAggregation() {
        try (InfluxDBClient client = InfluxDBClientFactory.create("http://localhost:8086", TOKEN.toCharArray())) {
            QueryApi queryApi = client.getQueryApi();

            // 基础聚合查询
            String flux = String.format("""
                from(bucket: "%s")
                  |> range(start: -1h)
                  |> filter(fn: (r) => r["_measurement"] == "cpu_metrics")
                  |> filter(fn: (r) => r["_field"] == "usage_percent")
                  |> aggregateWindow(every: 5m, fn: mean, createEmpty: false)
                """, BUCKET);

            List<FluxTable> tables = queryApi.query(flux, ORG);

            for (FluxTable table : tables) {
                for (FluxRecord record : table.getRecords()) {
                    System.out.printf("时间: %s, 平均CPU: %.2f%%\n",
                        record.getTime(),
                        record.getValue());
                }
            }
        }
    }

    // 多指标聚合分析
    public void performMultiMetricAggregation() {
        try (InfluxDBClient client = InfluxDBClientFactory.create("http://localhost:8086", TOKEN.toCharArray())) {
            QueryApi queryApi = client.getQueryApi();

            String flux = String.format("""
                data = from(bucket: "%s")
                  |> range(start: -24h)
                  |> filter(fn: (r) => r["_measurement"] == "server_metrics")

                cpu_stats = data
                  |> filter(fn: (r) => r["_field"] == "cpu_usage")
                  |> aggregateWindow(every: 1h, fn: mean, createEmpty: false)
                  |> set(key: "metric", value: "cpu_avg")

                memory_stats = data
                  |> filter(fn: (r) => r["_field"] == "memory_usage")
                  |> aggregateWindow(every: 1h, fn: max, createEmpty: false)
                  |> set(key: "metric", value: "memory_max")

                union(tables: [cpu_stats, memory_stats])
                  |> sort(columns: ["_time"])
                """, BUCKET);

            List<FluxTable> tables = queryApi.query(flux, ORG);

            for (FluxTable table : tables) {
                for (FluxRecord record : table.getRecords()) {
                    String metric = (String) record.getValueByKey("metric");
                    System.out.printf("%s - 时间: %s, 值: %.2f\n",
                        metric,
                        record.getTime(),
                        record.getValue());
                }
            }
        }
    }
}
高级聚合分析类
javaimport java.time.Instant;
import java.time.temporal.ChronoUnit;
import java.util.*;
import java.util.stream.Collectors;

public class AdvancedAggregationAnalyzer {

    private final InfluxDBClient client;
    private final String bucket;
    private final String org;

    public AdvancedAggregationAnalyzer(String url, String token, String bucket, String org) {
        this.client = InfluxDBClientFactory.create(url, token.toCharArray());
        this.bucket = bucket;
        this.org = org;
    }

    // 计算移动平均
    public List<TimeSeriesPoint> calculateMovingAverage(String measurement, String field,
                                                       int windowMinutes, int periodHours) {
        String flux = String.format("""
            from(bucket: "%s")
              |> range(start: -%dh)
              |> filter(fn: (r) => r["_measurement"] == "%s")
              |> filter(fn: (r) => r["_field"] == "%s")
              |> aggregateWindow(every: %dm, fn: mean, createEmpty: false)
              |> movingAverage(n: 5)
            """, bucket, periodHours, measurement, field, windowMinutes);

        return executeQuery(flux);
    }

    // 异常检测(基于标准差)
    public List<AnomalyPoint> detectAnomalies(String measurement, String field,
                                             double threshold, int hours) {
        String flux = String.format("""
            data = from(bucket: "%s")
              |> range(start: -%dh)
              |> filter(fn: (r) => r["_measurement"] == "%s")
              |> filter(fn: (r) => r["_field"] == "%s")

            stats = data
              |> mean()
              |> set(key: "_field", value: "mean")

            stddev_data = data
              |> stddev()
              |> set(key: "_field", value: "stddev")

            data
              |> map(fn: (r) => ({
                  _time: r._time,
                  _value: r._value,
                  is_anomaly: math.abs(r._value - 50.0) > %.2f * 10.0
              }))
              |> filter(fn: (r) => r.is_anomaly == true)
            """, bucket, hours, measurement, field, threshold);

        List<FluxTable> tables = client.getQueryApi().query(flux, org);
        List<AnomalyPoint> anomalies = new ArrayList<>();

        for (FluxTable table : tables) {
            for (FluxRecord record : table.getRecords()) {
                anomalies.add(new AnomalyPoint(
                    record.getTime(),
                    (Double) record.getValue(),
                    "Statistical anomaly detected"
                ));
            }
        }

        return anomalies;
    }

    // 趋势分析
    public TrendAnalysis analyzeTrend(String measurement, String field, int days) {
        String flux = String.format("""
            from(bucket: "%s")
              |> range(start: -%dd)
              |> filter(fn: (r) => r["_measurement"] == "%s")
              |> filter(fn: (r) => r["_field"] == "%s")
              |> aggregateWindow(every: 1h, fn: mean, createEmpty: false)
              |> derivative(unit: 1h, nonNegative: false)
              |> mean()
            """, bucket, days, measurement, field);

        List<FluxTable> tables = client.getQueryApi().query(flux, org);

        double trendSlope = 0.0;
        if (!tables.isEmpty() && !tables.get(0).getRecords().isEmpty()) {
            trendSlope = (Double) tables.get(0).getRecords().get(0).getValue();
        }

        return new TrendAnalysis(
            trendSlope > 0.1 ? "上升" : trendSlope < -0.1 ? "下降" : "稳定",
            trendSlope,
            calculateConfidence(Math.abs(trendSlope))
        );
    }

    private List<TimeSeriesPoint> executeQuery(String flux) {
        List<FluxTable> tables = client.getQueryApi().query(flux, org);
        List<TimeSeriesPoint> points = new ArrayList<>();

        for (FluxTable table : tables) {
            for (FluxRecord record : table.getRecords()) {
                points.add(new TimeSeriesPoint(
                    record.getTime(),
                    (Double) record.getValue()
                ));
            }
        }

        return points;
    }

    private double calculateConfidence(double slope) {
        return Math.min(95.0, 60.0 + slope * 100);
    }

    public void close() {
        client.close();
    }
}

// 数据模型类
class TimeSeriesPoint {
    private final Instant timestamp;
    private final Double value;

    public TimeSeriesPoint(Instant timestamp, Double value) {
        this.timestamp = timestamp;
        this.value = value;
    }

    // getters...
}

class AnomalyPoint {
    private final Instant timestamp;
    private final Double value;
    private final String reason;

    public AnomalyPoint(Instant timestamp, Double value, String reason) {
        this.timestamp = timestamp;
        this.value = value;
        this.reason = reason;
    }

    // getters...
}

class TrendAnalysis {
    private final String direction;
    private final double slope;
    private final double confidence;

    public TrendAnalysis(String direction, double slope, double confidence) {
        this.direction = direction;
        this.slope = slope;
        this.confidence = confidence;
    }

    // getters...
}
性能优化技巧
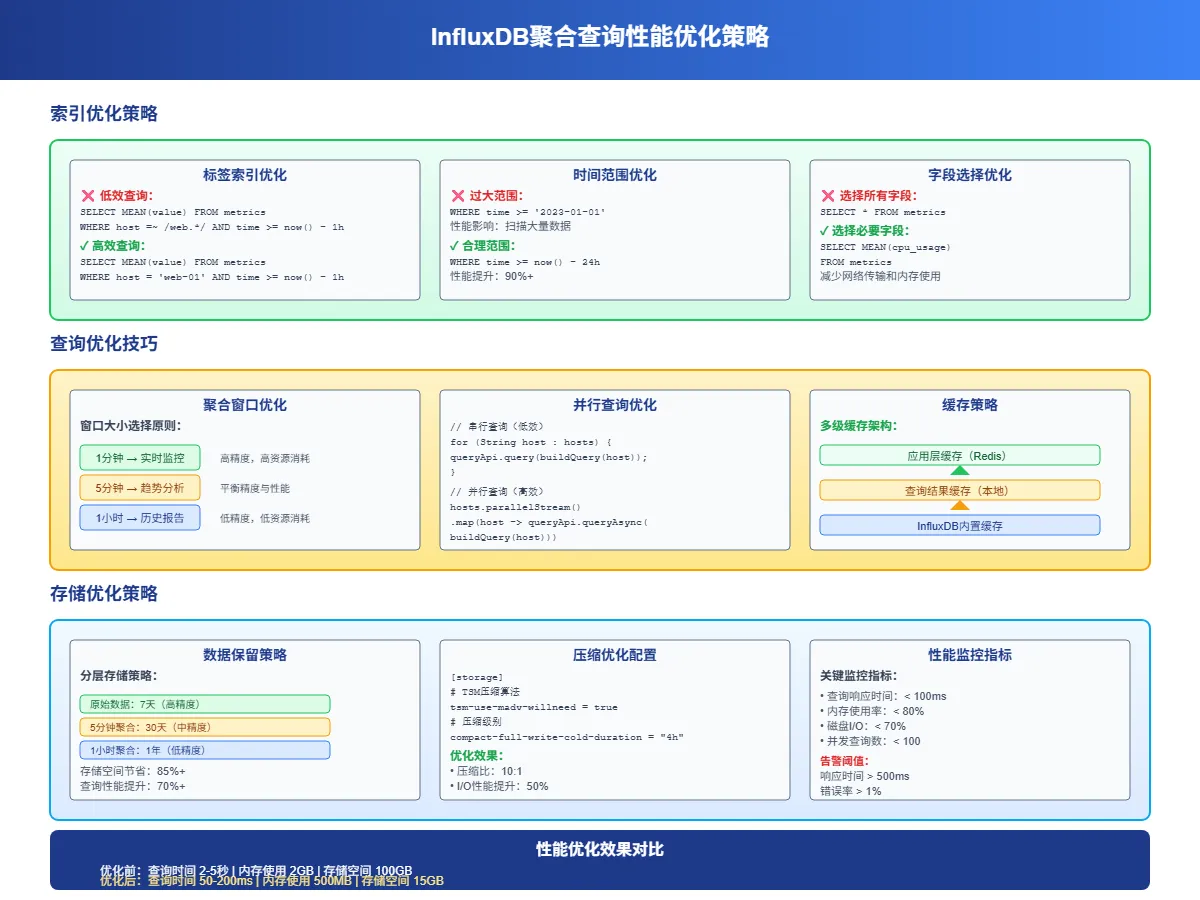
查询优化策略
合理使用时间范围:不要查询过长的时间范围,尽量限制在必要的时间窗口内:
sql-- 好的做法:限制时间范围
SELECT MEAN(cpu_usage) FROM system_metrics
WHERE time >= now() - 24h
GROUP BY time(1h)

-- 避免:查询所有历史数据
SELECT MEAN(cpu_usage) FROM system_metrics
GROUP BY time(1h)
选择合适的聚合间隔:聚合间隔要根据数据密度和分析需求来定:
sql-- 实时监控:5分钟间隔
SELECT MEAN(response_time) FROM api_metrics
WHERE time >= now() - 2h
GROUP BY time(5m)

-- 趋势分析:1小时间隔
SELECT MEAN(response_time) FROM api_metrics
WHERE time >= now() - 30d
GROUP BY time(1h)
索引优化
充分利用标签索引来加速查询:
sql-- 好的做法:先过滤标签再聚合
SELECT MEAN(cpu_usage) FROM system_metrics
WHERE server_id = 'web-01' AND time >= now() - 1h
GROUP BY time(5m)

-- 避免:先聚合再过滤
SELECT MEAN(cpu_usage) FROM system_metrics
WHERE time >= now() - 1h
GROUP BY time(5m), server_id
HAVING server_id = 'web-01'
常见问题解决
数据精度问题
聚合计算可能会丢失精度,特别是处理大数值时:
sql-- 使用ROUND函数控制精度
SELECT ROUND(MEAN(cpu_usage), 2) AS avg_cpu
FROM system_metrics
WHERE time >= now() - 1h
GROUP BY time(10m)
空值处理
合理处理空值和缺失数据:
sql-- 过滤空值
SELECT MEAN(cpu_usage) FROM system_metrics
WHERE cpu_usage IS NOT NULL AND time >= now() - 1h
GROUP BY time(5m)

-- 或者使用填充策略
SELECT MEAN(cpu_usage) FROM system_metrics
WHERE time >= now() - 1h
GROUP BY time(5m) fill(previous)
内存使用优化
对于大数据量查询,考虑分批处理:
java// Java中的分批查询示例
public void processLargeDataset(String measurement, int days) {
    int batchHours = 6; // 每次处理6小时的数据

    for (int i = 0; i < days * 24; i += batchHours) {
        String flux = String.format("""
            from(bucket: "%s")
              |> range(start: -%dh, stop: -%dh)
              |> filter(fn: (r) => r["_measurement"] == "%s")
              |> aggregateWindow(every: 1h, fn: mean)
            """, bucket, days * 24 - i, days * 24 - i - batchHours, measurement);

        // 处理这批数据
        processBatch(flux);
    }
}
InfluxDB 的聚合函数功能强大且灵活,掌握这些技巧能让你的时序数据分析事半功倍。下一篇文章我们将通过一个完整的物联网监控系统实战案例,看看如何在真实项目中应用这些聚合分析技术。


本文作者:柳始恭
本文链接:
版权声明:本博客所有文章除特别声明外,均采用 BY-NC-SA 许可协议。转载请注明出处!